menu

Bethel Island, CA

This is a small community in a single neighborhood. As throughout the site, some neighborhood-level data are reserved for subscribers.


Overview

Bethel Island is a very small town located in the state of California. With a population of 2,131 people and just one neighborhood, Bethel Island is the 655th largest community in California.

Housing costs in Bethel Island are among some of the highest in the nation, although real estate prices here don't compare to real estate prices in the most expensive communities in California.

Occupations and Workforce

Because occupations involving physical labor dominate the local economy, Bethel Island is generally considered to be a blue-collar town. 58.13% of the Bethel Island workforce is employed in blue-collar occupations, compared to the national average of 27.7%. Overall, Bethel Island is a town of construction workers and builders, managers, and sales and office workers. There are especially a lot of people living in Bethel Island who work in management occupations (14.35%), sales jobs (11.24%), and healthcare (11.24%).

A relatively large number of people in Bethel Island telecommute to their jobs. Overall, about 14.75% of the workforce works from home. While this may seem like a small number, as a fraction of the total workforce it ranks among the highest in the country. These workers are often telecommuters who work in knowledge-based, white-collar professions. For example, Silicon Valley has large numbers of people who telecommute. Other at-home workers may be self-employed people who operate small businesses out of their homes.

Setting & Lifestyle

Residents will find that the town is relatively quiet. This is because it is not over-populated, and it has fewer college students, renters, and young children - all of whom can be noisy at times. So, if you're looking for a relatively peaceful place to live, Bethel Island is worth considering.

Being a small town, Bethel Island does not have a public transit system used by locals to get to and from work.

Demographics

The education level of Bethel Island citizens, measured as those with bachelor's degrees or advanced degrees, is similar to the national average for all American cities and towns. 18.89% of adults 25 and older in Bethel Island have a college degree.

The per capita income in Bethel Island in 2022 was $39,932, which is middle income relative to California, and upper middle income relative to the rest of the US. This equates to an annual income of $159,728 for a family of four. However, Bethel Island contains both very wealthy and poor people as well. Bethel Island also has one of the higher rates of people living in poverty in the nation, with 34.60% of its population below the federal poverty line.

Bethel Island is an extremely ethnically-diverse town. The people who call Bethel Island home describe themselves as belonging to a variety of racial and ethnic groups. The greatest number of Bethel Island residents report their race to be White, followed by Asian. Bethel Island also has a sizeable Hispanic population (people of Hispanic origin can be of any race). People of Hispanic or Latino origin account for 41.68% of the town’s residents. Important ancestries of people in Bethel Island include English, Italian, German, Scottish, and Irish.

Bethel Island also has a high percentage of its population that was born in another country: 28.65%.

The most common language spoken in Bethel Island is English. Other important languages spoken here include Spanish and Chinese.

Notable & Unique Neighborhood Characteristics

Many things matter about a neighborhood, but the first thing most people notice is the way a neighborhood looks and its particular character. For example, one might notice whether the buildings all date from a certain time period or whether shop signs are in multiple languages. This particular neighborhood in Bethel Island, the neighborhood, has some outstanding things about the way it looks and its way of life that are worth highlighting.

Length of Commute

Regardless of the means by which residents commute, this neighborhood has a length of commute that is notable. Long commutes can be brutal. They take time, money, and energy, leaving less of you for yourself and your family. The residents of the neighborhood unfortunately have the distinction of having, on average, a longer commute than most any neighborhood in America. 14.5% of commuters here travel more than one hour just one-way to work. That is more than two hours per day. This percentage with two-hour + round-trip commutes is higher than NeighborhoodScout found in 98.5% of all neighborhoods in America.

Diversity

Did you know that the neighborhood has more Canadian and Scots-Irish ancestry people living in it than nearly any neighborhood in America? It's true! In fact, 1.1% of this neighborhood's residents have Canadian ancestry and 3.2% have Scots-Irish ancestry.

is also pretty special linguistically. Significantly, 1.0% of its residents five years old and above primarily speak Japanese at home. While this may seem like a small percentage, it is higher than 97.4% of the neighborhoods in America.

The Neighbors

There are two complementary measures for understanding the income of a neighborhood's residents: the average and the extremes. While a neighborhood may be relatively wealthy overall, it is equally important to understand the rate of people - particularly children - who are living at or below the federal poverty line, which is extremely low income. Some neighborhoods with a lower average income may actually have a lower childhood poverty rate than another with a higher average income, and this helps us understand the conditions and character of a neighborhood.

The neighbors in the neighborhood in Bethel Island are middle-income, making it a moderate income neighborhood. NeighborhoodScout's exclusive analysis reveals that this neighborhood has a higher income than 58.6% of the neighborhoods in America. With 12.2% of the children here below the federal poverty line, this neighborhood has a higher rate of childhood poverty than 55.6% of U.S. neighborhoods.

A neighborhood is far different if it is dominated by enlisted military personnel rather than people who earn their living by farming. It is also different if most of the neighbors are clerical support or managers. What is wonderful is the sheer diversity of neighborhoods, allowing you to find the type that fits your lifestyle and aspirations.

In the neighborhood, 39.3% of the working population is employed in manufacturing and laborer occupations. The second most important occupational group in this neighborhood is executive, management, and professional occupations, with 36.1% of the residents employed. Other residents here are employed in sales and service jobs, from major sales accounts, to working in fast food restaurants (16.2%), and 8.4% in clerical, assistant, and tech support occupations.

Languages

The languages spoken by people in this neighborhood are diverse. These are tabulated as the languages people preferentially speak when they are at home with their families. The most common language spoken in the neighborhood is English, spoken by 70.0% of households. Other important languages spoken here include Spanish and Tagalog (the first language of the Philippine region).

Ethnicity / Ancestry

Culture is the shared learned behavior of peoples. Undeniably, different ethnicities and ancestries have different cultural traditions, and as a result, neighborhoods with concentrations of residents of one or another ethnicities or ancestries will express those cultures. It is what makes the North End in Boston so fun to visit for the Italian restaurants, bakeries, culture, and charm, and similarly, why people enjoy visiting Chinatown in San Francisco.

In the neighborhood in Bethel Island, CA, residents most commonly identify their ethnicity or ancestry as Mexican (21.0%). There are also a number of people of English ancestry (15.9%), and residents who report German roots (13.6%), and some of the residents are also of Irish ancestry (9.5%), along with some Asian ancestry residents (8.0%), among others. In addition, 18.6% of the residents of this neighborhood were born in another country.

Getting to Work

Even if your neighborhood is walkable, you may still have to drive to your place of work. Some neighborhoods are located where many can get to work in just a few minutes, while others are located such that most residents have a long and arduous commute. The greatest number of commuters in neighborhood spend between 45 minutes and one hour commuting one-way to work (31.5% of working residents), longer and tougher than most commutes in America.

Here most residents (70.3%) drive alone in a private automobile to get to work. In addition, quite a number also carpool with coworkers, friends, or neighbors to get to work (6.4%) . In a neighborhood like this, as in most of the nation, many residents find owning a car useful for getting to work.

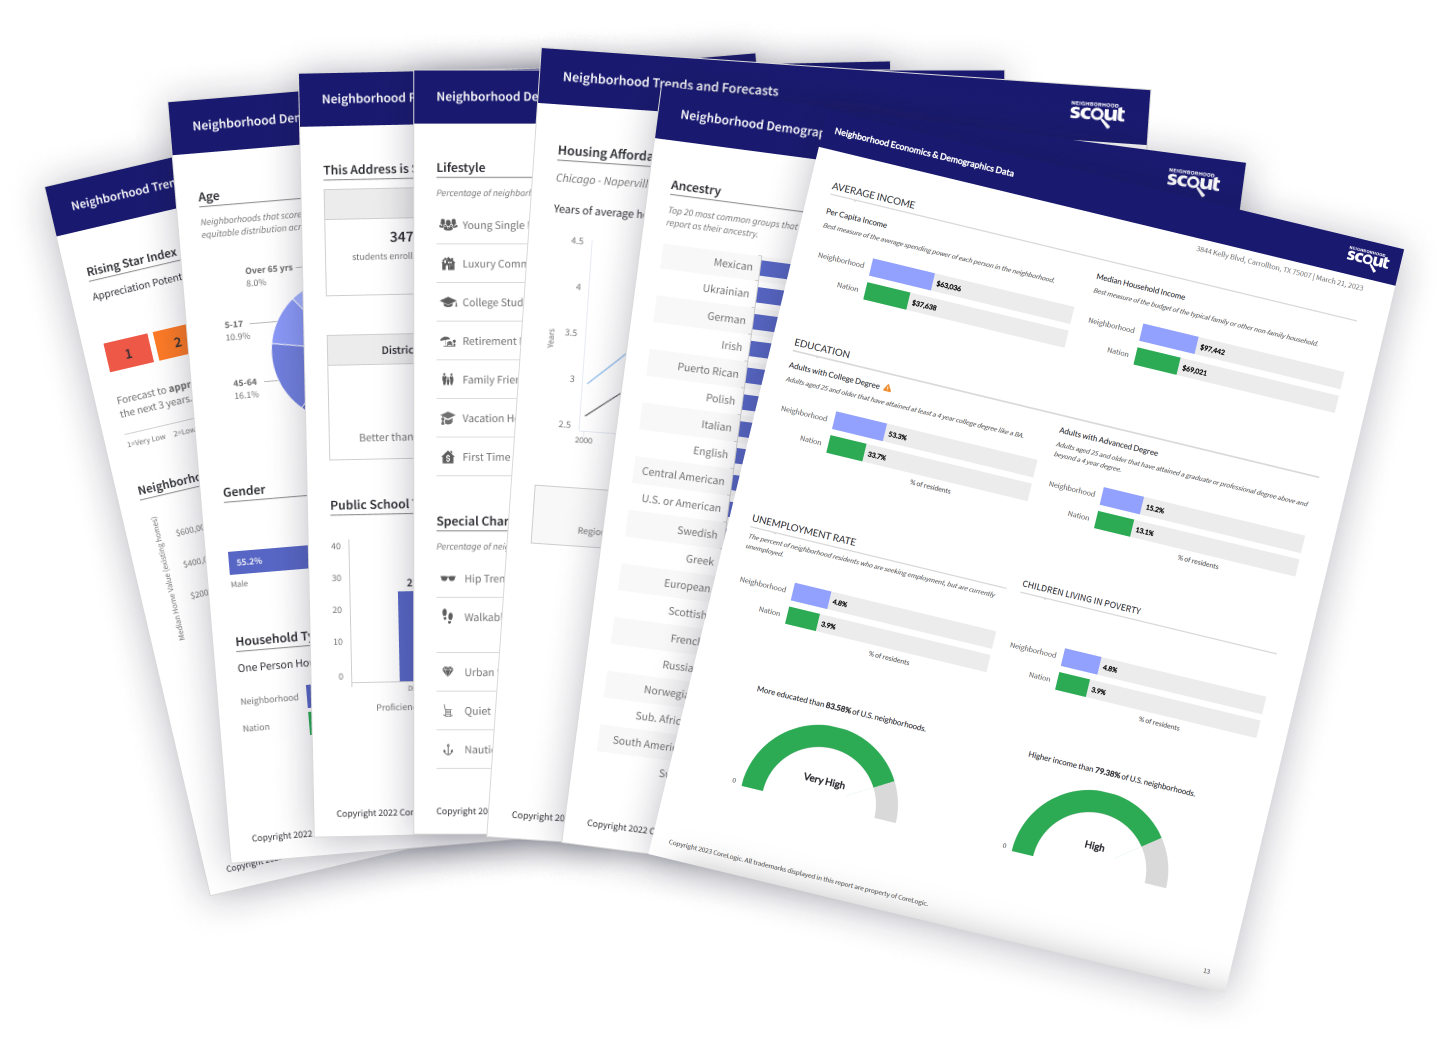
Real Estate includes:
Average Home Values
Rental Market
Housing Market Details
Neighborhood Setting
Economics & Demographics include:
Lifestyle & Special Character
Household Types
Commute To Work
Migration & Mobility
Race & Ethnic Diversity
Employment Industries & Occupations
Income & Unemployment Rate
Higher Education Attainment
Crime includes:
Neighborhood Crime Index
Crimes Per Square Mile
Property Crime Comparison
Violent Crime Comparison
Schools include:
School Ratings
Schools In District
Public School Test Scores
School District Enrollment
Educational Expenditures

comparable neighborhoods nearby