Niland is a tiny town located in the state of California. With a population of 756 people and just one neighborhood, Niland is the 776th largest community in California.
Because occupations involving physical labor dominate the local economy, Niland is generally considered to be a blue-collar town. 50.94% of the Niland workforce is employed in blue-collar occupations, compared to the national average of 27.7%. Overall, Niland is a town of service providers, construction workers and builders, and transportation and shipping workers. There are especially a lot of people living in Niland who work in healthcare suport services (31.39%), law enforcement and fire fighting (9.21%), and farm management occupations (8.65%).
A relatively large number of people in Niland telecommute to their jobs. Overall, about 15.98% of the workforce works from home. While this may seem like a small number, as a fraction of the total workforce it ranks among the highest in the country. These workers are often telecommuters who work in knowledge-based, white-collar professions. For example, Silicon Valley has large numbers of people who telecommute. Other at-home workers may be self-employed people who operate small businesses out of their homes.
The town is relatively quiet, having a combination of lower population density and few of those groups of people who have a tendency to be noisy. For example, Niland has relatively fewer families with younger children, and/or college students. Combined, this makes Niland a pretty quiet place to live overall. If you like quiet, you will probably enjoy it here.
Despite the fact that it is a small town, Niland has quite a few people who take public transportation – mostly the bus - for their daily commute to work. This helps to fill a real need in the town for affordable transportation.
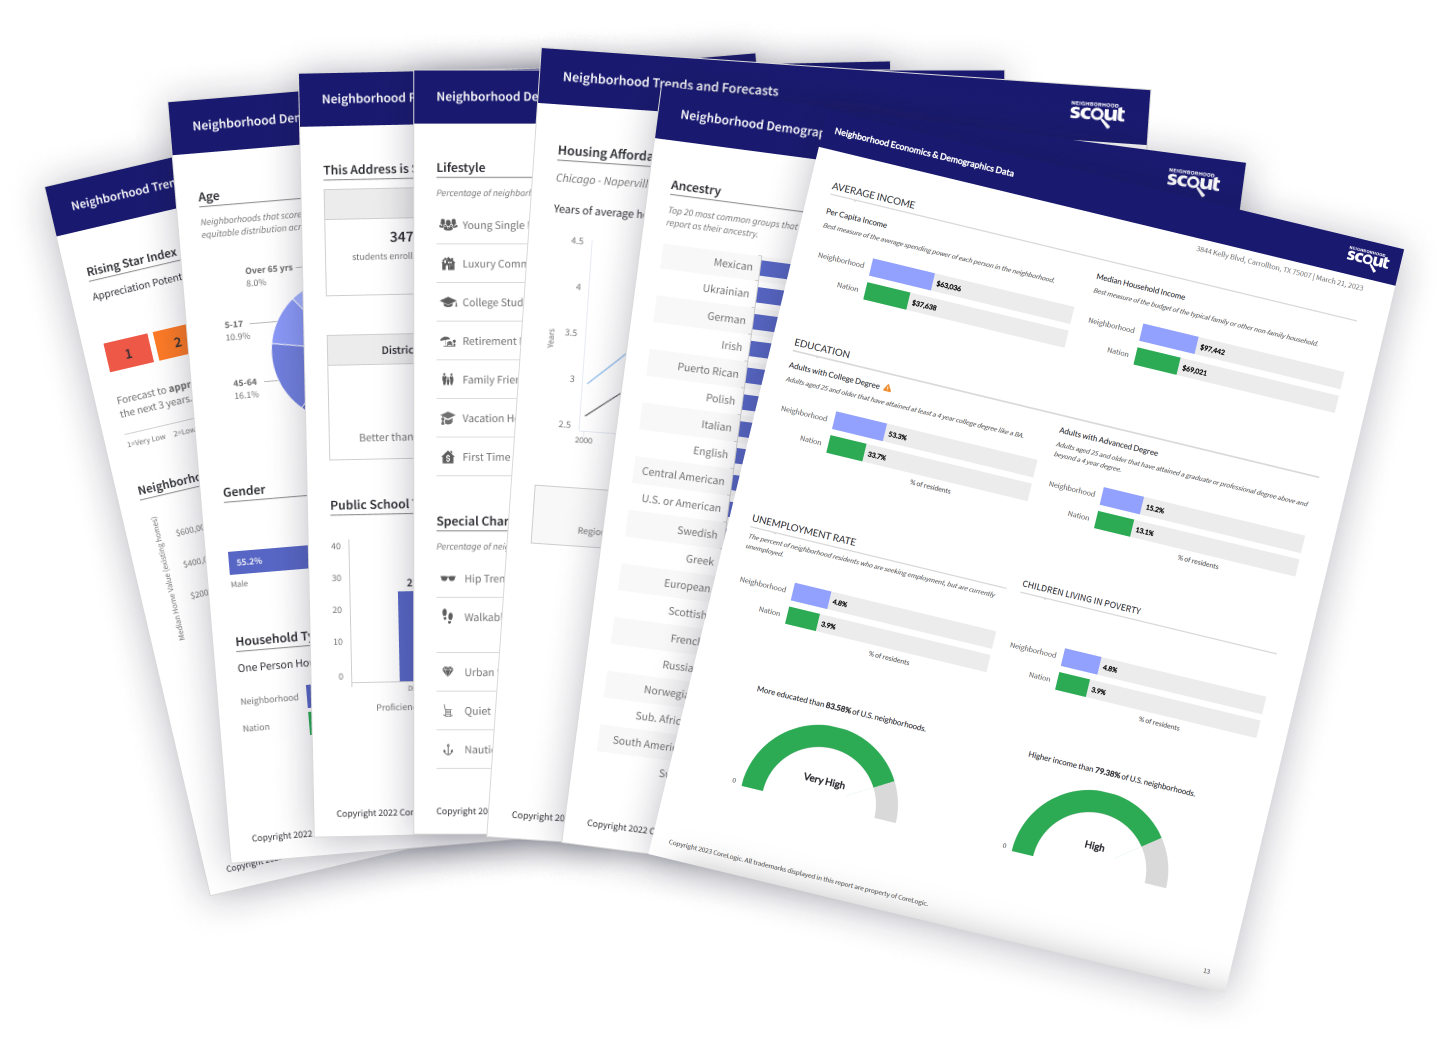
In terms of college education, the citizens of Niland rank slightly lower than the national average. 14.44% of adults 25 and older in Niland have a bachelor's degree or advanced degree, while 21.84% of adults have a 4-year degree or higher in the average American community.
The per capita income in Niland in 2022 was $16,050, which is low income relative to California and the nation. This equates to an annual income of $64,200 for a family of four. However, Niland contains both very wealthy and poor people as well.
Niland is an extremely ethnically-diverse town. The people who call Niland home describe themselves as belonging to a variety of racial and ethnic groups. People of Hispanic or Latino origin are the most prevalent group in Niland, accounting for 87.19% of the town’s residents (people of Hispanic or Latino origin can be of any race). The greatest number of Niland residents report their race to be Black or African-American, followed by White. Important ancestries of people in Niland include German, French, Yugoslavian, Other West Indian, and West Indian.
Foreign born people are also an important part of Niland's cultural character, accounting for 26.34% of the town’s population.
The most common language spoken in Niland is Spanish. Other important languages spoken here include English and Italian.
The way a neighborhood looks and feels when you walk or drive around it, from its setting, its buildings, and its flavor, can make all the difference. This neighborhood has some really cool things about the way it looks and feels as revealed by NeighborhoodScout's exclusive research. This might include anything from the housing stock to the types of households living here to how people get around.
Of note is NeighborhoodScout's research finding that the neighborhood has some of the lowest rates of children living in poverty of any neighborhood in the United States. In a nation where approximately 1 in 4 children are living in poverty, the community truly stands out from the rest in this regard.
In addition, an interesting characteristic about the neighborhood is that there are more incarcerated people living here than 99.8% of neighborhoods in the U.S. The United States has the highest rate of incarceration in the world, currently with 1 out of every 100 adults in the country are incarcerated as a punishment for crimes committed. The extremely high incarceration rate of this neighborhood could mean that a prison, juvenile detention facility or other correctional facility occupies a large proportion of the neighborhood, or contains a large portion of the neighborhood's population.
Also, neighborhoodScout's exclusive research revealed that 99.6% of the adult residents in the neighborhood do not have a 4-year college degree, which is a lower rate of college graduated adults than found in 98.9% of the neighborhoods in America.
It used to be that most Americans lived on the farm, or otherwise made their living from the land, the forests, or the sea. With global trade and an economy increasingly based on providing services to one another, fewer people farm, fish or harvest timber now than at any time in American history. But according to NeighborhoodScout's leading analysis, the neighborhood stands apart from most American neighborhood due to the proportion of its residents still working in these fields. With 76.1% of the workforce so employed, this neighborhood has a greater concentration of such workers than 100.0% of U.S. neighborhoods.
Our research reveals that 97.4% of commuters who live in the neighborhood get to work each day by driving alone in their automobiles, which is a higher proportion than 99.9% of U.S. neighborhoods.
Whether walking, biking, riding, or driving, the length of one's commute is an important factor for one's quality of life. The neighborhood stands out for its commute length, according to NeighborhoodScout's analysis. Long commutes can be brutal. They take time, money, and energy, leaving less of you for yourself and your family. The residents of the neighborhood unfortunately have the distinction of having, on average, a longer commute than most any neighborhood in America. 21.4% of commuters here travel more than one hour just one-way to work. That is more than two hours per day. This percentage with two-hour + round-trip commutes is higher than NeighborhoodScout found in 99.7% of all neighborhoods in America.
Renter-occupied real estate is dominant in the neighborhood. The percentage of rental real estate here, according to exclusive NeighborhoodScout analysis, is 98.3%, which is higher than 98.8% of the neighborhoods in America. If you were to buy and live in the property you bought here, you would be almost alone in doing so.
In addition, three-deckers, duplexes, old Victorian homes cut up into apartments. Independent stores on the corner selling pizza. These are some of the hallmarks of neighborhoods with lots of small 2, 3, and 4 unit apartment buildings. The neighborhood really stands out in this regard, however, as it is dominated by such small apartment buildings more than nearly any other neighborhood in America. This is a stunning visual and lifestyle example of this type of neighborhood. In fact, 40.6% of the real estate here are small 2, 3, or 4 unit apartment buildings, which is a higher proportion than found in 97.3% of America's neighborhoods.
Furthermore, unpopulated, and rural, the neighborhood is one of the least crowded neighborhoods in all of America. If you like open space, no traffic, and lots of room, this neighborhood may be just what you are looking for. According to NeighborhoodScout's leading research, this neighborhood is less densely populated than 93.9% of the neighborhoods in America.
Did you know that the neighborhood has more Mexican ancestry people living in it than nearly any neighborhood in America? It's true! In fact, 58.4% of this neighborhood's residents have Mexican ancestry.
is also pretty special linguistically. Significantly, 0.9% of its residents five years old and above primarily speak Native American languages at home. While this may seem like a small percentage, it is higher than 97.1% of the neighborhoods in America.
How wealthy a neighborhood is, from very wealthy, to middle income, to low income is very formative with regard to the personality and character of a neighborhood. Equally important is the rate of people, particularly children, who live below the federal poverty line. In some wealthy gated communities, the areas immediately surrounding can have high rates of childhood poverty, which indicates other social issues. NeighborhoodScout's analysis reveals both aspects of income and poverty for this neighborhood.
The neighbors in the neighborhood in Niland are low income, making it among the lowest income neighborhoods in America. NeighborhoodScout's research shows that this neighborhood has an income lower than 100.0% of U.S. neighborhoods. In addition, 0.0% of the children seventeen and under living in this neighborhood are living below the federal poverty line, which is a lower rate of childhood poverty than is found in 100.0% of America's neighborhoods.
A neighborhood is far different if it is dominated by enlisted military personnel rather than people who earn their living by farming. It is also different if most of the neighbors are clerical support or managers. What is wonderful is the sheer diversity of neighborhoods, allowing you to find the type that fits your lifestyle and aspirations.
In the neighborhood, 76.1% of the working population is employed in farming, forestry, or commercial fishing. The second most important occupational group in this neighborhood is executive, management, and professional occupations, with 20.5% of the residents employed. Other residents here are employed in clerical, assistant, and tech support occupations (2.6%).
Languages
The most common language spoken in the neighborhood is Spanish, spoken by 57.2% of households. Some people also speak English (39.6%).
Ethnicity / Ancestry
Culture is shared learned behavior. We learn it from our parents, their parents, our houses of worship, and much of our culture – our learned behavior – comes from our ancestors. That is why ancestry and ethnicity can be so interesting and important to understand: places with concentrations of people of one or more ancestries often express those shared learned behaviors and this gives each neighborhood its own culture. Even different neighborhoods in the same city can have drastically different cultures.
In the neighborhood in Niland, CA, residents most commonly identify their ethnicity or ancestry as Mexican (58.4%). There are also a number of people of Sub-Saharan African ancestry (4.9%), and residents who report African roots (4.3%), and some of the residents are also of Asian ancestry (2.5%), along with some Puerto Rican ancestry residents (2.2%), among others. In addition, 15.4% of the residents of this neighborhood were born in another country.
Even if your neighborhood is walkable, you may still have to drive to your place of work. Some neighborhoods are located where many can get to work in just a few minutes, while others are located such that most residents have a long and arduous commute. The greatest number of commuters in neighborhood spend between 15 and 30 minutes commuting one-way to work (35.9% of working residents), which is shorter than the time spent commuting to work for most Americans. However, there is also a significant group of residents (21.4%) who commute over an hour in each direction.
Here most residents (97.4%) drive alone in a private automobile to get to work. In a neighborhood like this, as in most of the nation, many residents find owning a car useful for getting to work.