Downtown median real estate price is $186,851, which is less expensive than 91.4% of Connecticut neighborhoods and 83.8% of all U.S. neighborhoods.
The average rental price in Downtown is currently $3,010, based on NeighborhoodScout's exclusive analysis. The average rental cost in this neighborhood is higher than 68.5% of the neighborhoods in Connecticut.
Downtown is a densely urban neighborhood (based on population density) located in New Haven, Connecticut.
Downtown real estate is primarily made up of small (studio to two bedroom) to medium sized (three or four bedroom) apartment complexes/high-rise apartments and small apartment buildings. Most of the residential real estate is renter occupied. Many of the residences in the Downtown neighborhood are older, well-established, built between 1940 and 1969. A number of residences were also built between 1970 and 1999.
Downtown has a 14.8% vacancy rate, which is well above average compared to other U.S. neighborhoods (higher than 79.5% of American neighborhoods). Most vacant housing here is vacant year round. This could either signal that there is a weak demand for real estate in the neighborhood or that large amount of new housing has been built and not yet occupied. Either way, if you live here, you may find many of the homes or apartments are empty.
When you see a neighborhood for the first time, the most important thing is often the way it looks, like its homes and its setting. Some places look the same, but they only reveal their true character after living in them for a while because they contain a unique mix of occupational or cultural groups. This neighborhood is very unique in some important ways, according to NeighborhoodScout's exclusive exploration and analysis.
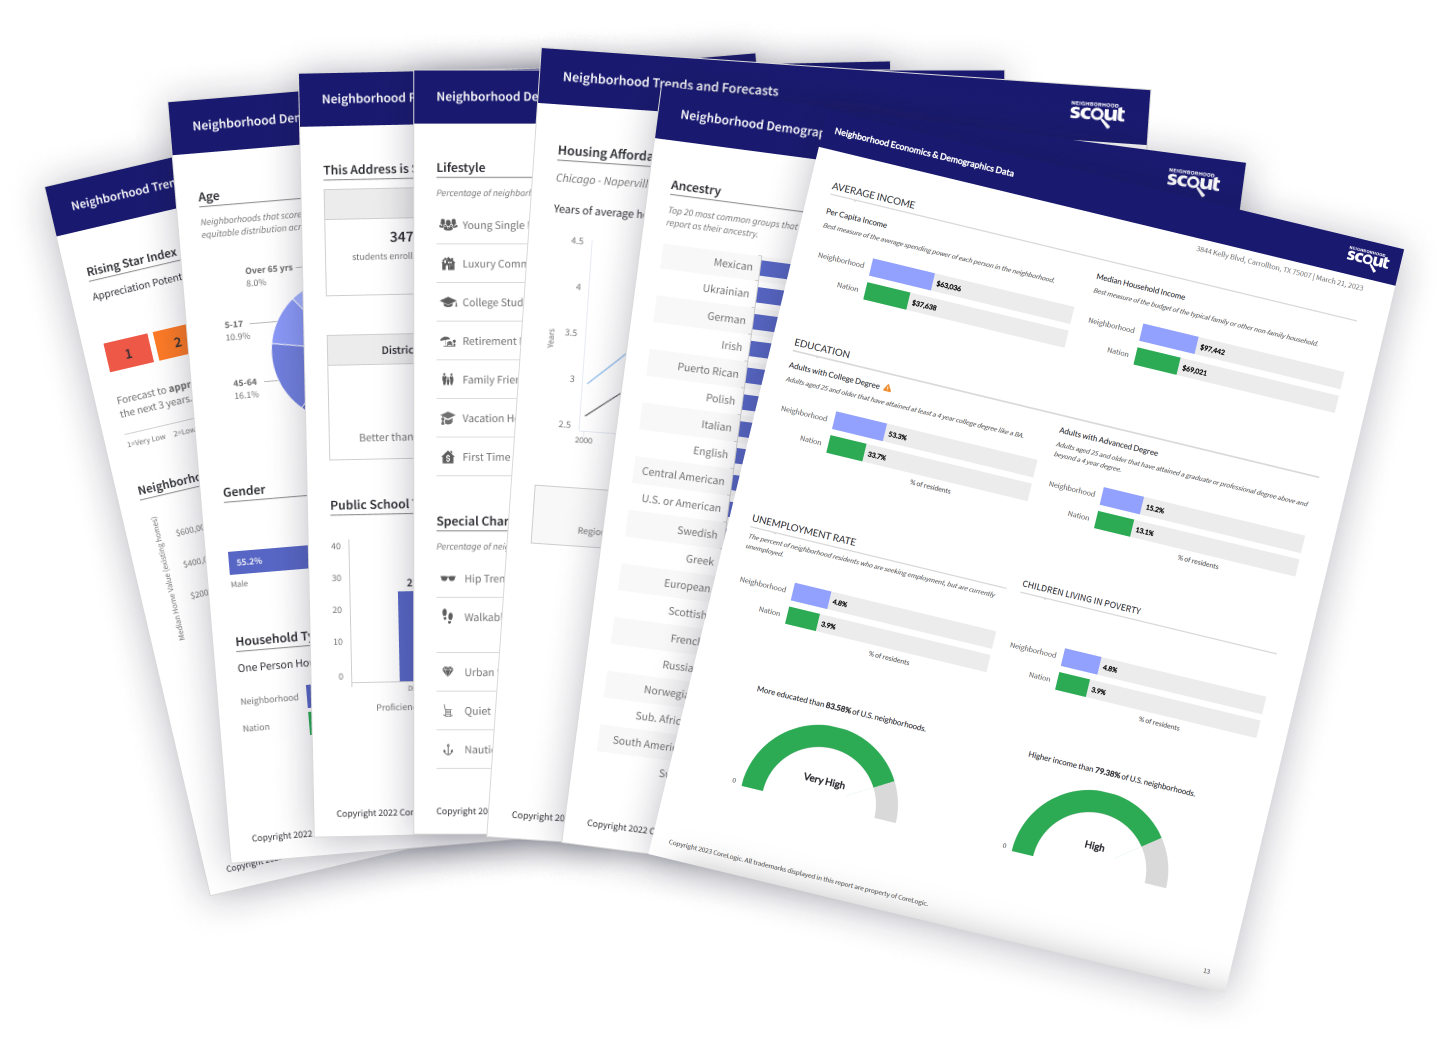
Of note is NeighborhoodScout's research finding that the Downtown neighborhood has some of the lowest rates of children living in poverty of any neighborhood in the United States. In a nation where approximately 1 in 4 children are living in poverty, the Downtown community truly stands out from the rest in this regard.
In addition, some neighborhoods have residents that are more educated than others. But in this neighborhood there is a dramatic difference. NeighborhoodScout's exclusive analysis reveals that 56.0% of the adults here have earned a Masters degree, medical degree, Ph.D. or law degree. This is a higher rate of people with a graduate degree than is found in 99.6% of U.S. neighborhoods, where the average American neighborhood has 14.1% of its adults with a graduate degree. If you are highly educated, you may have much in common with many of your neighbors here.
Also, the Downtown neighborhood stands out within Connecticut for its college student friendly environment. NeighborhoodScout's analysis reveals that this neighborhood is home to a number of college students, is relatively walkable, and above average in safety. In combination, this makes it stand out for a good place for college students to consider. Because a number of college students live here, this neighborhood may be close to a college campus and offer certain amenities nearby geared towards the student body. While it's not an environment for everyone, ambitious scholars can enjoy seasonal excitement between semesters and school breaks, and parents can rest easy knowing that the area has an above average safety rating. For each of these reasons, the neighborhood is rated among the top 8.0% of college-friendly places to live in CT.
More people in Downtown choose to walk to work each day (48.7%) than almost any neighborhood in America. If you are attracted to the idea of being able to walk to work, this neighborhood could be a good choice.
One of the really unique and interesting things about the look and setting of the Downtown neighborhood is that it is almost entirely dominated by large apartment buildings, such as apartment complexes or high-rise apartments. 92.0% of the residential real estate here is classified as such. This puts this neighborhood on the map as having a higher proportion of large apartment buildings than 98.5% of all neighborhoods in America.
In addition, the Downtown neighborhood is very unique in that it has one of the highest proportions of one, two, or no bedroom real estate of any neighborhood in America. Most neighborhoods have a mixture of home or apartment sizes from small to large, but here the concentration of studios and other small living spaces is at near-record heights. With 91.7% of the real estate here of this small size, this most assuredly is a notable feature that makes this neighborhood unique, along with just a handful of other neighborhoods in the U.S. that share this characteristic.
Furthermore, renter-occupied real estate is dominant in the Downtown neighborhood. The percentage of rental real estate here, according to exclusive NeighborhoodScout analysis, is 94.6%, which is higher than 97.9% of the neighborhoods in America. If you were to buy and live in the property you bought here, you would be almost alone in doing so.
Also of note, if you like crowded places, then you will probably enjoy the the Downtown neighborhood. According to NeighborhoodScout's exclusive data analysis, this neighborhood is more densely populated than 96.5% of neighborhoods in the U.S., with 27,110 people per square mile living here.
Regardless of the means by which residents commute, this neighborhood has a length of commute that is notable. Residents of the Downtown neighborhood have the pleasure of having one of the shortest commutes to work of any neighborhood in America. 67.4% of the residents have a commute time from home to work (one way) of less than fifteen minutes. This is a higher proportion of residents enjoying a short trip to work than NeighborhoodScout found in 98.1% of U.S. neighborhoods. Less time commuting means more time for other things in life.
We Americans love our cars. Not only are they a necessity for most Americans due to the shape of our neighborhoods and the distances between where we live, work, shop, and go to school, but we also fancy them. As a result, most households in America have one, two, or three cars. But NeighborhoodScout's exclusive analysis shows that the Downtown neighborhood has a highly unusual pattern of car ownership. 39.4% of the households in this neighborhood don't own a car at all. This is more carless households than NeighborhoodScout found in 98.0% of U.S. neighborhoods.
Executives, managers and professionals make up 71.1% of the workforce in the Downtown neighborhood which, according to NeighborhoodScout's exclusive analysis, is a higher proportion of such high-level people than is found in 95.4% of the neighborhoods in America. For this reason, this neighborhood really stands out as unique.
The freedom of moving to new places versus the comfort of home. How much and how often people move not only can create diverse and worldly neighborhoods, but simultaneously it can produce a loss of intimacy with one's surroundings and a lack of connectedness to one's neighbors. NeighborhoodScout's exclusive research has identified this neighborhood as unique with regard to the transience of its populace. In the Downtown neighborhood, a greater proportion of the residents living here today did not live here five years ago than is found in 97.3% of U.S. Neighborhoods. This neighborhood, more than almost any other in America, has new residents from other areas.
Did you know that the Downtown neighborhood has more British and Haitian ancestry people living in it than nearly any neighborhood in America? It's true! In fact, 2.0% of this neighborhood's residents have British ancestry and 2.1% have Haitian ancestry.
Downtown is also pretty special linguistically. Significantly, 10.9% of its residents five years old and above primarily speak Chinese at home. While this may seem like a small percentage, it is higher than 98.0% of the neighborhoods in America.
How wealthy a neighborhood is, from very wealthy, to middle income, to low income is very formative with regard to the personality and character of a neighborhood. Equally important is the rate of people, particularly children, who live below the federal poverty line. In some wealthy gated communities, the areas immediately surrounding can have high rates of childhood poverty, which indicates other social issues. NeighborhoodScout's analysis reveals both aspects of income and poverty for this neighborhood.
The neighbors in the Downtown neighborhood in New Haven are low income, making it among the lowest income neighborhoods in America. NeighborhoodScout's research shows that this neighborhood has an income lower than 88.9% of U.S. neighborhoods. In addition, 0.0% of the children seventeen and under living in this neighborhood are living below the federal poverty line, which is a lower rate of childhood poverty than is found in 100.0% of America's neighborhoods.
What we choose to do for a living reflects who we are. Each neighborhood has a different mix of occupations represented, and together these tell you about the neighborhood and help you understand if this neighborhood may fit your lifestyle.
In the Downtown neighborhood, 71.1% of the working population is employed in executive, management, and professional occupations. The second most important occupational group in this neighborhood is sales and service jobs, from major sales accounts, to working in fast food restaurants, with 18.8% of the residents employed. Other residents here are employed in clerical, assistant, and tech support occupations (9.7%).
Languages
The languages spoken by people in this neighborhood are diverse. These are tabulated as the languages people preferentially speak when they are at home with their families. The most common language spoken in the Downtown neighborhood is English, spoken by 69.1% of households. Other important languages spoken here include Chinese and Spanish.
Ethnicity / Ancestry
Culture is shared learned behavior. We learn it from our parents, their parents, our houses of worship, and much of our culture – our learned behavior – comes from our ancestors. That is why ancestry and ethnicity can be so interesting and important to understand: places with concentrations of people of one or more ancestries often express those shared learned behaviors and this gives each neighborhood its own culture. Even different neighborhoods in the same city can have drastically different cultures.
In the Downtown neighborhood in New Haven, CT, residents most commonly identify their ethnicity or ancestry as Asian (21.9%). There are also a number of people of Italian ancestry (9.6%), and residents who report Irish roots (8.4%), and some of the residents are also of Polish ancestry (4.2%), along with some Puerto Rican ancestry residents (3.9%), among others. In addition, 24.2% of the residents of this neighborhood were born in another country.
Even if your neighborhood is walkable, you may still have to drive to your place of work. Some neighborhoods are located where many can get to work in just a few minutes, while others are located such that most residents have a long and arduous commute. The greatest number of commuters in Downtown neighborhood spend under 15 minutes commuting one-way to work (67.4% of working residents), one of the shortest commutes across America.
Here most residents (48.7%) hop out the door and walk to work to get to work. In addition, quite a number also drive alone in a private automobile to get to work (15.9%) and 5.7% of residents also carpool with coworkers, friends, or neighbors for their daily commute. This is a special neighborhood for the number of people who walk to work. Combining exercise, low cost, and reduced pollution, plus the chance to see your neighbors, walking to work is fairly uncommon in America but likely to increase as people try to reduce their dependence on automobiles, and this neighborhood offers that opportunity today.