menu

Greenwood, FL

This is a small community in a single neighborhood. As throughout the site, some neighborhood-level data are reserved for subscribers.


Overview


Greenwood is a tiny town located in the state of Florida. With a population of 561 people and just one neighborhood, Greenwood is the 461st largest community in Florida.

Occupations and Workforce

Unlike some towns where white-collar or blue-collar occupations dominate the local economy, Greenwood is neither predominantly one nor the other. Instead, it has a mixed workforce of both white- and blue-collar jobs. Overall, Greenwood is a town of service providers, sales and office workers, and managers. There are especially a lot of people living in Greenwood who work in office and administrative support (15.76%), management occupations (12.32%), and law enforcement and fire fighting (11.75%).

Setting & Lifestyle

It is a fairly quiet town because there are relatively few of those groups of people who have a tendency to be noisy. (Children, for example, often can't help themselves from being noisy, and being parents ourselves, we know!) Greenwood has relatively few families with children living at home, and is quieter because of it. Renters and college students, for their own reasons, can also be noisy. Greenwood has few renters and college students. But the biggest reason it is quieter in Greenwood than in most places in America, is that there are just simply fewer people living here. If you think trees make good neighbors, Greenwood may be for you.

One downside of living in Greenwood, however, is that residents on average have to contend with a long commute, spending on average 31.57 minutes every day commuting to work.

As is often the case in a small town, Greenwood doesn't have a public transportation system that people use for their commute.

Demographics

The education level of Greenwood citizens is a little higher than the average for US cities and towns: 21.93% of adults in Greenwood have at least a bachelor's degree.

The per capita income in Greenwood in 2022 was $25,244, which is low income relative to Florida and the nation. This equates to an annual income of $100,976 for a family of four. However, Greenwood contains both very wealthy and poor people as well.

Greenwood is an extremely ethnically-diverse town. The people who call Greenwood home describe themselves as belonging to a variety of racial and ethnic groups. The greatest number of Greenwood residents report their race to be White, followed by Black or African-American. Important ancestries of people in Greenwood include Irish, English, German, Welsh, and Scottish.

The most common language spoken in Greenwood is English. Other important languages spoken here include Portuguese and Spanish.

Notable & Unique Neighborhood Characteristics

The way a neighborhood looks and feels when you walk or drive around it, from its setting, its buildings, and its flavor, can make all the difference. This neighborhood has some really cool things about the way it looks and feels as revealed by NeighborhoodScout's exclusive research. This might include anything from the housing stock to the types of households living here to how people get around.

Modes of Transportation

While most Americans do drive to work alone each day, the neighborhood stands out by having 94.6% of commuters doing so, which is a higher proportion of people driving alone to work than NeighborhoodScout found in 99.6% of all American neighborhoods.

People

Astoundingly, the neighborhood has one of the highest concentrations of divorcees living here than of any neighborhood, a higher concentration than NeighborhoodScout found in 97.4% of U.S. neighborhoods. This may be because people living here divorce more often than others, or that divorced people move here after they become divorced. If you are divorced, you will be in good company in this particular Greenwood neighborhood.

In addition, the neighborhood has a greater percentage of children living in poverty (56.6%) than found in 96.2% of all U.S. neighborhoods. Children living in poverty is one of the challenges facing America, and the world, and in this neighborhood in particular, the problem can be considered acute.

Occupations

It used to be that most Americans lived on the farm, or otherwise made their living from the land, the forests, or the sea. With global trade and an economy increasingly based on providing services to one another, fewer people farm, fish or harvest timber now than at any time in American history. But according to NeighborhoodScout's leading analysis, the neighborhood stands apart from most American neighborhood due to the proportion of its residents still working in these fields. With 3.9% of the workforce so employed, this neighborhood has a greater concentration of such workers than 95.8% of U.S. neighborhoods.

Real Estate

The real estate in this neighborhood consists of more mobile homes than 95.6% of all neighborhoods in America, with 30.7% of the occupied housing here being classified as mobile homes. So if you are looking for a mobile home, or you like the look and feel of mobile home parks, this neighborhood might have the setting you desire.

In addition, this neighborhood has wide open spaces, few people, and lots of space to stretch out. If you like locations that fit that description, you may like this neighborhood. Based on NeighborhoodScout's exclusive analysis, with only 31 people per square mile living here, this neighborhood is less crowded than 92.6% of America.

Diversity

Did you know that the neighborhood has more Dutch ancestry people living in it than nearly any neighborhood in America? It's true! In fact, 3.9% of this neighborhood's residents have Dutch ancestry.

The Neighbors

How wealthy a neighborhood is, from very wealthy, to middle income, to low income is very formative with regard to the personality and character of a neighborhood. Equally important is the rate of people, particularly children, who live below the federal poverty line. In some wealthy gated communities, the areas immediately surrounding can have high rates of childhood poverty, which indicates other social issues. NeighborhoodScout's analysis reveals both aspects of income and poverty for this neighborhood.

The neighbors in the neighborhood in Greenwood are low income, making it among the lowest income neighborhoods in America. NeighborhoodScout's research shows that this neighborhood has an income lower than 86.4% of U.S. neighborhoods. With 56.6% of the children here below the federal poverty line, this neighborhood has a higher rate of childhood poverty than 96.2% of U.S. neighborhoods.

What we choose to do for a living reflects who we are. Each neighborhood has a different mix of occupations represented, and together these tell you about the neighborhood and help you understand if this neighborhood may fit your lifestyle.

In the neighborhood, 40.8% of the working population is employed in executive, management, and professional occupations. The second most important occupational group in this neighborhood is sales and service jobs, from major sales accounts, to working in fast food restaurants, with 22.9% of the residents employed. Other residents here are employed in manufacturing and laborer occupations (17.3%), and 15.1% in clerical, assistant, and tech support occupations.

Languages

The most common language spoken in the neighborhood is English, spoken by 92.8% of households. Some people also speak Spanish (5.3%).

Ethnicity / Ancestry

Culture is the shared learned behavior of peoples. Undeniably, different ethnicities and ancestries have different cultural traditions, and as a result, neighborhoods with concentrations of residents of one or another ethnicities or ancestries will express those cultures. It is what makes the North End in Boston so fun to visit for the Italian restaurants, bakeries, culture, and charm, and similarly, why people enjoy visiting Chinatown in San Francisco.

In the neighborhood in Greenwood, FL, residents most commonly identify their ethnicity or ancestry as Irish (7.5%). There are also a number of people of English ancestry (6.3%), and residents who report Dutch roots (3.9%), and some of the residents are also of German ancestry (1.7%), along with some Mexican ancestry residents (1.1%), among others.

Getting to Work

How you get to work – car, bus, train or other means – and how much of your day it takes to do so is a large quality of life and financial issue. Especially with gasoline prices rising and expected to continue doing so, the length and means of one's commute can be a financial burden. Some neighborhoods are physically located so that many residents have to drive in their own car, others are set up so many walk to work, or can take a train, bus, or bike. The greatest number of commuters in neighborhood spend between 15 and 30 minutes commuting one-way to work (45.8% of working residents), which is shorter than the time spent commuting to work for most Americans.

Here most residents (94.6%) drive alone in a private automobile to get to work. In a neighborhood like this, as in most of the nation, many residents find owning a car useful for getting to work.


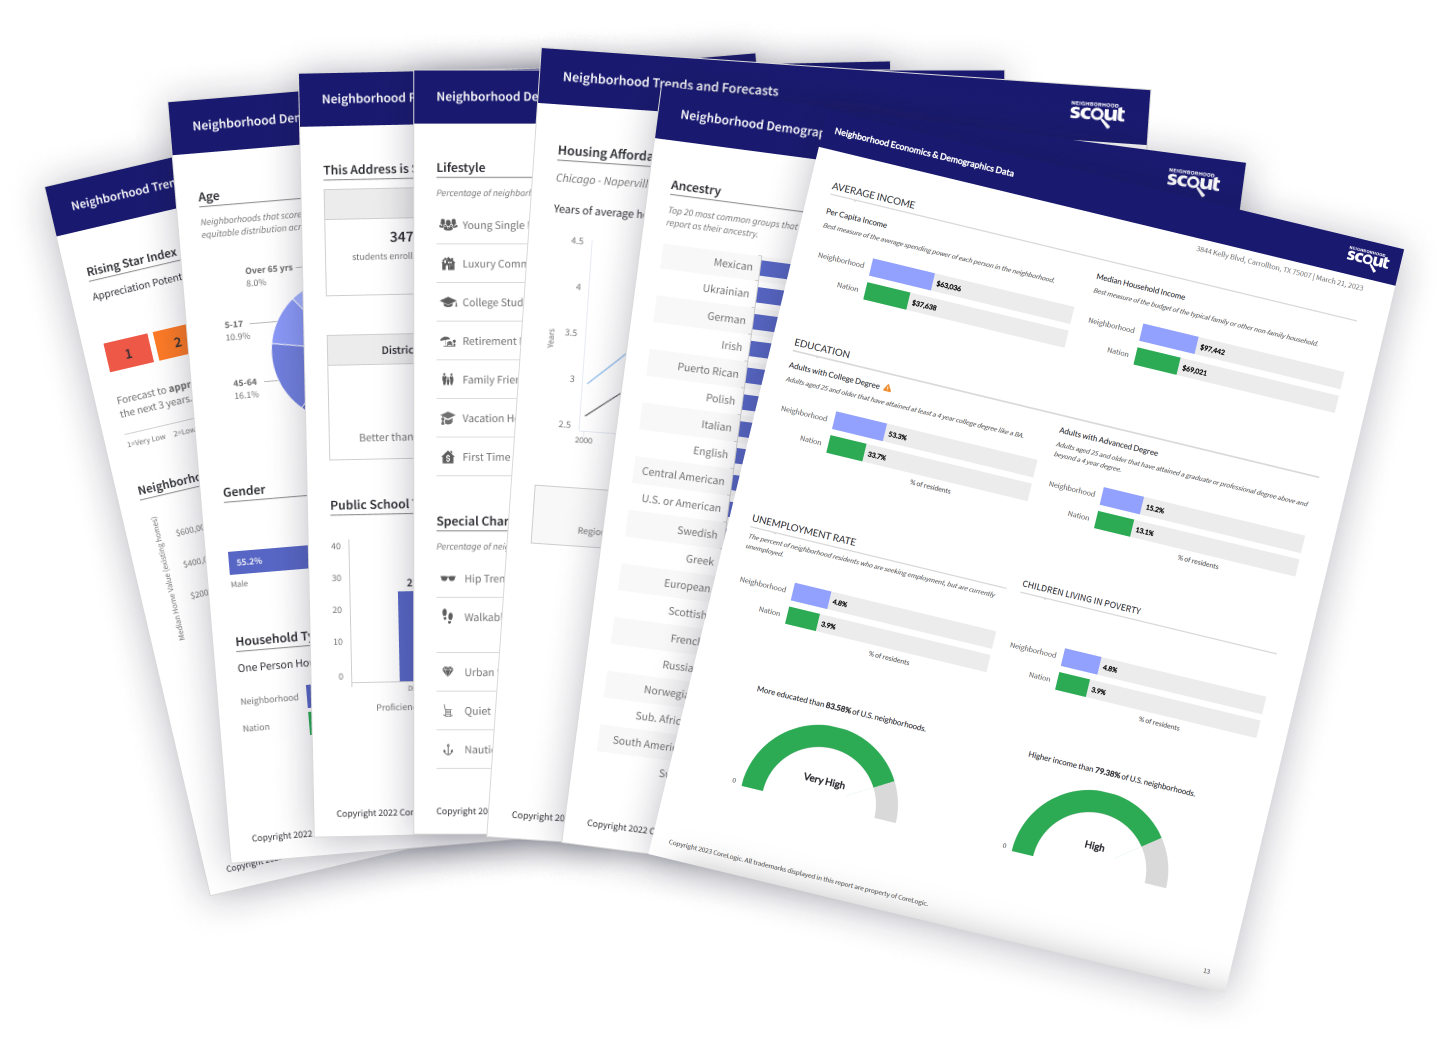
Real Estate includes:
Average Home Values
Rental Market
Housing Market Details
Neighborhood Setting
Economics & Demographics include:
Lifestyle & Special Character
Household Types
Commute To Work
Migration & Mobility
Race & Ethnic Diversity
Employment Industries & Occupations
Income & Unemployment Rate
Higher Education Attainment
Crime includes:
Neighborhood Crime Index
Crimes Per Square Mile
Property Crime Comparison
Violent Crime Comparison
Schools include:
School Ratings
Schools In District
Public School Test Scores
School District Enrollment
Educational Expenditures

comparable neighborhoods nearby