menu

Leland, IL

This is a small community in a single neighborhood. As throughout the site, some neighborhood-level data are reserved for subscribers.


Overview

Leland is a tiny village located in the state of Illinois. With a population of 928 people and just one neighborhood, Leland is the 687th largest community in Illinois. Much of the housing stock in Leland was built prior to World War II, making it one of the older and more historic villages in the country.

Occupations and Workforce

Leland is neither predominantly blue-collar nor white-collar, instead having a mixed workforce of both blue-collar and white-collar jobs. Overall, Leland is a village of service providers, sales and office workers, and professionals. There are especially a lot of people living in Leland who work in office and administrative support (10.35%), management occupations (9.52%), and sales jobs (8.70%).

Of important note, Leland is also a village of artists. Leland has more artists, designers and people working in media than 90% of the communities in America. This concentration of artists helps shape Leland’s character.

Setting & Lifestyle

Because of many things, Leland is a very good place for families to consider. With an enviable combination of good schools, low crime, college-educated neighbors who tend to support education because of their own experiences, and a high rate of home ownership in predominantly single-family properties, Leland really has some of the features that families look for when choosing a good community to raise children. Is Leland perfect? Of course not, and if you like frenetic nightlife, it will be far from your cup of tea. But overall this is a solid community, with many things to recommend it as a family-friendly place to live.

One downside of living in Leland, however, is that residents on average have to contend with a long commute, spending on average 34.08 minutes every day commuting to work.

As is often the case in a small village, Leland doesn't have a public transportation system that people use for their commute.

Demographics

The overall education level of Leland citizens is substantially higher than the typical US community, as 29.38% of adults in Leland have at least a bachelor's degree, and the average American community has 21.84%.

The per capita income in Leland in 2022 was $33,425, which is lower middle income relative to Illinois, and middle income relative to the rest of the US. This equates to an annual income of $133,700 for a family of four. However, Leland contains both very wealthy and poor people as well.

The people who call Leland home describe themselves as belonging to a variety of racial and ethnic groups. The greatest number of Leland residents report their race to be White. Important ancestries of people in Leland include German, Irish, English, Italian, and French.

The most common language spoken in Leland is English. Other important languages spoken here include Polish and Spanish.

Notable & Unique Neighborhood Characteristics

When you see a neighborhood for the first time, the most important thing is often the way it looks, like its homes and its setting. Some places look the same, but they only reveal their true character after living in them for a while because they contain a unique mix of occupational or cultural groups. This neighborhood is very unique in some important ways, according to NeighborhoodScout's exclusive exploration and analysis.

Length of Commute

Regardless of the means by which residents commute, this neighborhood has a length of commute that is notable. Long commutes can be brutal. They take time, money, and energy, leaving less of you for yourself and your family. The residents of the neighborhood unfortunately have the distinction of having, on average, a longer commute than most any neighborhood in America. 16.2% of commuters here travel more than one hour just one-way to work. That is more than two hours per day. This percentage with two-hour + round-trip commutes is higher than NeighborhoodScout found in 99.0% of all neighborhoods in America.

Occupations

Each year, fewer and fewer Americans make their living as farmers, foresters, or fishers. But the neighborhood truly stands out among U.S. neighborhoods. According to exclusive NeighborhoodScout analysis, this neighborhood has a greater proportion of farmers, foresters, or fishers than 98.4% of all American neighborhoods. This is truly a unique cultural characteristic of this neighborhood.

Diversity

Did you know that the neighborhood has more Austrian and Norwegian ancestry people living in it than nearly any neighborhood in America? It's true! In fact, 1.4% of this neighborhood's residents have Austrian ancestry and 5.1% have Norwegian ancestry.

The Neighbors

How wealthy a neighborhood is, from very wealthy, to middle income, to low income is very formative with regard to the personality and character of a neighborhood. Equally important is the rate of people, particularly children, who live below the federal poverty line. In some wealthy gated communities, the areas immediately surrounding can have high rates of childhood poverty, which indicates other social issues. NeighborhoodScout's analysis reveals both aspects of income and poverty for this neighborhood.

The neighbors in the neighborhood in Leland are middle-income, making it a moderate income neighborhood. NeighborhoodScout's exclusive analysis reveals that this neighborhood has a higher income than 55.3% of the neighborhoods in America. With 24.2% of the children here below the federal poverty line, this neighborhood has a higher rate of childhood poverty than 75.8% of U.S. neighborhoods.

What we choose to do for a living reflects who we are. Each neighborhood has a different mix of occupations represented, and together these tell you about the neighborhood and help you understand if this neighborhood may fit your lifestyle.

In the neighborhood, 29.1% of the working population is employed in executive, management, and professional occupations. The second most important occupational group in this neighborhood is sales and service jobs, from major sales accounts, to working in fast food restaurants, with 24.0% of the residents employed. Other residents here are employed in manufacturing and laborer occupations (23.8%), and 15.9% in clerical, assistant, and tech support occupations.

Languages

The languages spoken by people in this neighborhood are diverse. These are tabulated as the languages people preferentially speak when they are at home with their families. The most common language spoken in the neighborhood is English, spoken by 96.5% of households. Other important languages spoken here include Polish and Spanish.

Ethnicity / Ancestry

Culture is the shared learned behavior of peoples. Undeniably, different ethnicities and ancestries have different cultural traditions, and as a result, neighborhoods with concentrations of residents of one or another ethnicities or ancestries will express those cultures. It is what makes the North End in Boston so fun to visit for the Italian restaurants, bakeries, culture, and charm, and similarly, why people enjoy visiting Chinatown in San Francisco.

In the neighborhood in Leland, IL, residents most commonly identify their ethnicity or ancestry as German (25.8%). There are also a number of people of Irish ancestry (15.7%), and residents who report English roots (9.9%), and some of the residents are also of Polish ancestry (5.4%), along with some Norwegian ancestry residents (5.1%), among others.

Getting to Work

Even if your neighborhood is walkable, you may still have to drive to your place of work. Some neighborhoods are located where many can get to work in just a few minutes, while others are located such that most residents have a long and arduous commute. The greatest number of commuters in neighborhood spend between 15 and 30 minutes commuting one-way to work (33.1% of working residents), which is shorter than the time spent commuting to work for most Americans. However, there is also a significant group of residents (16.2%) who commute over an hour in each direction.

Here most residents (78.4%) drive alone in a private automobile to get to work. In addition, quite a number also carpool with coworkers, friends, or neighbors to get to work (14.5%) . In a neighborhood like this, as in most of the nation, many residents find owning a car useful for getting to work.

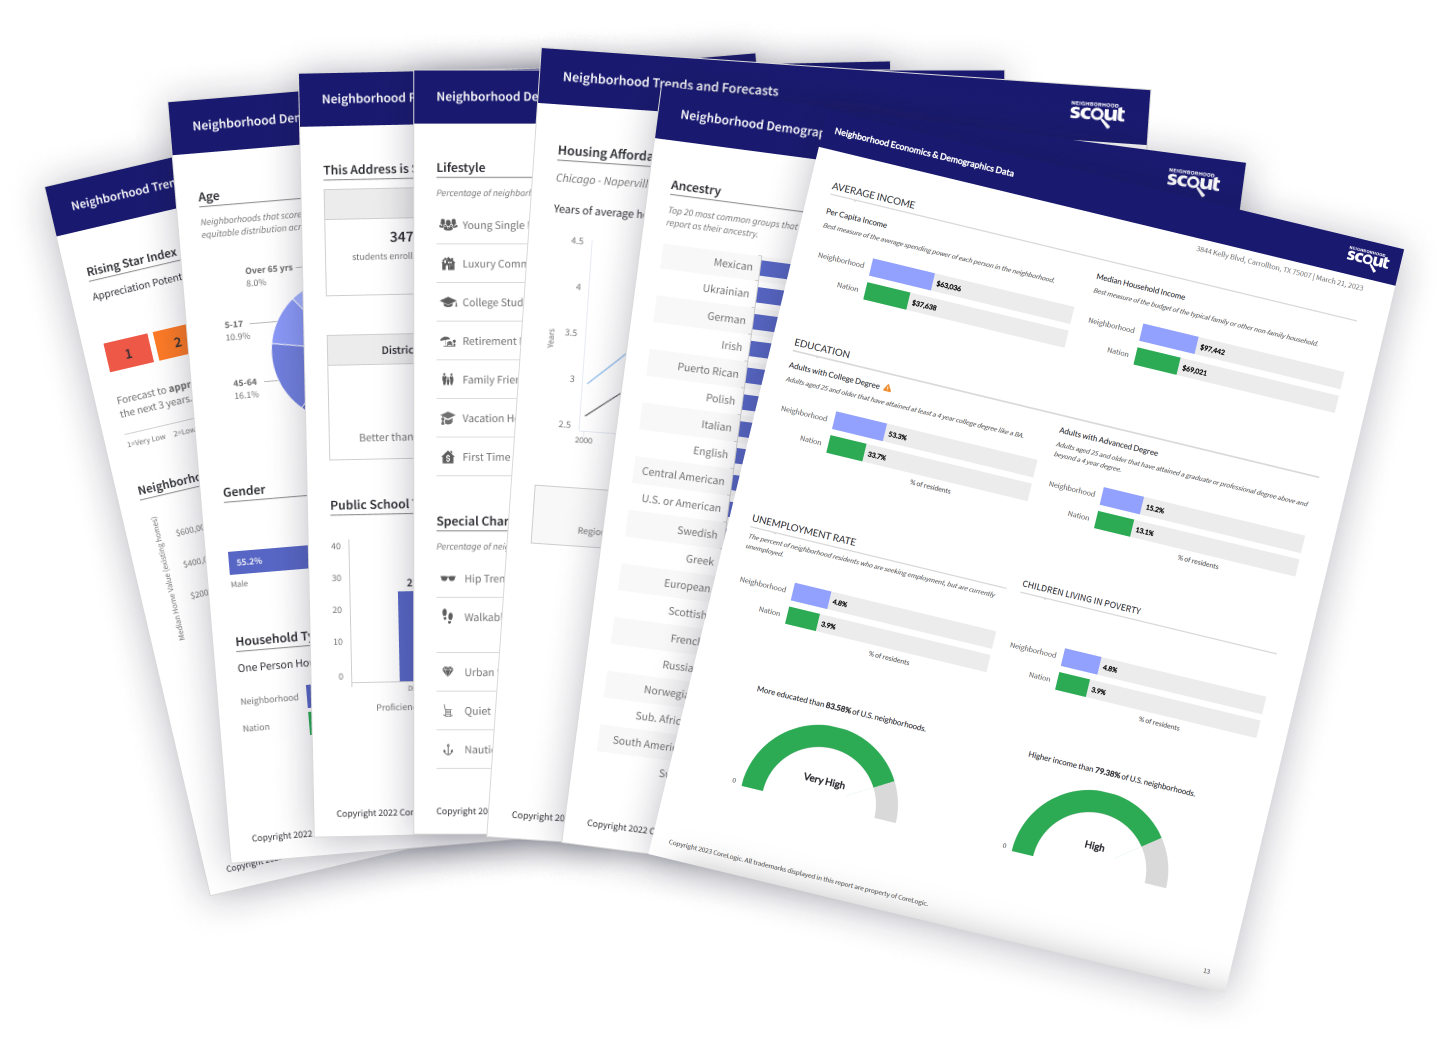
Real Estate includes:
Average Home Values
Rental Market
Housing Market Details
Neighborhood Setting
Economics & Demographics include:
Lifestyle & Special Character
Household Types
Commute To Work
Migration & Mobility
Race & Ethnic Diversity
Employment Industries & Occupations
Income & Unemployment Rate
Higher Education Attainment
Crime includes:
Neighborhood Crime Index
Crimes Per Square Mile
Property Crime Comparison
Violent Crime Comparison
Schools include:
School Ratings
Schools In District
Public School Test Scores
School District Enrollment
Educational Expenditures

comparable neighborhoods nearby