menu


Real Estate Prices & Overview

St. Pete / Saint Peters University median real estate price is $655,103, which is more expensive than 58.0% of the neighborhoods in New Jersey and 76.7% of the neighborhoods in the U.S.

The average rental price in St. Pete / Saint Peters University is currently $2,601, based on NeighborhoodScout's exclusive analysis. Rents here are currently lower in price than 80.3% of New Jersey neighborhoods.

St. Pete / Saint Peters University is a densely urban neighborhood (based on population density) located in Jersey City, New Jersey.

St. Pete / Saint Peters University real estate is primarily made up of small (studio to two bedroom) to medium sized (three or four bedroom) apartment complexes/high-rise apartments and small apartment buildings. Most of the residential real estate is renter occupied. Many of the residences in the St. Pete / Saint Peters University neighborhood are older, well-established, built between 1940 and 1969. A number of residences were also built before 1940.

Home and apartment vacancy rates are 6.8% in St. Pete / Saint Peters University. NeighborhoodScout analysis shows that this rate is lower than 52.2% of the neighborhoods in the nation, approximately near the middle range for vacancies.

Notable & Unique Neighborhood Characteristics

The way a neighborhood looks and feels when you walk or drive around it, from its setting, its buildings, and its flavor, can make all the difference. This neighborhood has some really cool things about the way it looks and feels as revealed by NeighborhoodScout's exclusive research. This might include anything from the housing stock to the types of households living here to how people get around.

People

St. Pete / Saint Peters University has the amazing distinction of housing more same sex couples living together than 98.8% of neighborhoods in the U.S. If you are seeking such a neighborhood, NeighborhoodScout's analysis shows that this is one place that you should consider.

In addition, neighborhoodScout's analysis shows that the St. Pete / Saint Peters University neighborhood has a greater concentration of residents currently enrolled in college than 95.9% of the neighborhoods in the U.S. With 11.5% of the population here attending college, this is very much a college-focused neighborhood.

Occupations

There are more people living in the St. Pete / Saint Peters University neighborhood employed as sales and service workers (55.2%) than almost any neighborhood in the country. From fast-food service workers to major sales accounts, sales and service workers make up the largest proportion of our national employment picture. But despite that size and importance nationally, this neighborhood still stands out as unique due to the dominance of people living here who work in such occupations.

Real Estate

The St. Pete / Saint Peters University neighborhood is very densely populated compared to most U.S. neighborhoods. In fact, with 49,438 persons per square mile in the neighborhood, it is more packed with people than 98.4% of the nation's neighborhoods. Even if you drive or take transit to your place of employment, many people enjoy being able to walk in their neighborhood. What many people don't realize is that most of America's premier vacation locations are also very walkable. The St. Pete / Saint Peters University neighborhood is among the top 5% of American neighborhoods in terms of walkability.

Modes of Transportation

Our research revealed that more commuters here take the bus to work (17.2% ride the bus) than 98.3% of all American neighborhoods. If you like the idea of leaving your car and home and hopping the bus to work, this might be a good neighborhood for you to consider.

Also, in the St. Pete / Saint Peters University neighborhood, 14.9% of people ride the train to work each day. This is a very high percentage compared to most places. In fact, NeighborhoodScout's analysis reveals that this is a higher level of train ridership than in 96.8% of the neighborhoods in America.

Finally, would you like to be able to ride your bike to work? If you are attracted to the idea of getting a little exercise of the two-wheeled type while reducing your carbon footprint, bicycling to work might be the answer. But which neighborhood you live in can make this either impossible, or alternatively, a great and realistic option. NeighborhoodScout's analysis revealed that the St. Pete / Saint Peters University neighborhood is a fantastic option for bicycle commuters, as 3.4% of commuters here do ride their bikes to and from work on a daily basis. This is a higher amount than we found in 96.4% of the neighborhoods in America.

Car Ownership

We Americans love our cars. Not only are they a necessity for most Americans due to the shape of our neighborhoods and the distances between where we live, work, shop, and go to school, but we also fancy them. As a result, most households in America have one, two, or three cars. But NeighborhoodScout's exclusive analysis shows that the St. Pete / Saint Peters University neighborhood has a highly unusual pattern of car ownership. 27.2% of the households in this neighborhood don't own a car at all. This is more carless households than NeighborhoodScout found in 96.7% of U.S. neighborhoods.

Diversity

Did you know that the St. Pete / Saint Peters University neighborhood has more Arab and Dominican ancestry people living in it than nearly any neighborhood in America? It's true! In fact, 7.0% of this neighborhood's residents have Arab ancestry and 11.2% have Dominican ancestry.

St. Pete / Saint Peters University is also pretty special linguistically. Significantly, 6.2% of its residents five years old and above primarily speak Arabic at home. While this may seem like a small percentage, it is higher than 98.9% of the neighborhoods in America.

Migration / Stability

Some neighborhoods have more internal cohesiveness than others. While other neighborhoods feel like a collection of strangers who just happen to live near each other. Sometimes this comes down to not only the personalities of the people in a place, but how long people have been together in that neighborhood. NeighborhoodScout's research has revealed some interesting things about the rootedness of people in the St. Pete / Saint Peters University neighborhood. What is interesting to note, is that the St. Pete / Saint Peters University neighborhood has a greater percentage of residents born in another country (52.6%) than are found in 98.0% of all U.S. neighborhoods.

The Neighbors

How wealthy a neighborhood is, from very wealthy, to middle income, to low income is very formative with regard to the personality and character of a neighborhood. Equally important is the rate of people, particularly children, who live below the federal poverty line. In some wealthy gated communities, the areas immediately surrounding can have high rates of childhood poverty, which indicates other social issues. NeighborhoodScout's analysis reveals both aspects of income and poverty for this neighborhood.

The neighbors in the St. Pete / Saint Peters University neighborhood in Jersey City are middle-income, making it a moderate income neighborhood. NeighborhoodScout's exclusive analysis reveals that this neighborhood has a higher income than 42.3% of the neighborhoods in America. With 16.4% of the children here below the federal poverty line, this neighborhood has a higher rate of childhood poverty than 64.1% of U.S. neighborhoods.

The old saying "you are what you eat" is true. But it is also true that you are what you do for a living. The types of occupations your neighbors have shape their character, and together as a group, their collective occupations shape the culture of a place.

In the St. Pete / Saint Peters University neighborhood, 44.8% of the working population is employed in sales and service jobs, from major sales accounts, to working in fast food restaurants. The second most important occupational group in this neighborhood is executive, management, and professional occupations, with 24.1% of the residents employed. Other residents here are employed in manufacturing and laborer occupations (15.9%), and 15.2% in clerical, assistant, and tech support occupations.

Languages

The languages spoken by people in this neighborhood are diverse. These are tabulated as the languages people preferentially speak when they are at home with their families. The most common language spoken in the St. Pete / Saint Peters University neighborhood is English, spoken by 39.5% of households. Other important languages spoken here include Spanish, Arabic, Tagalog (the first language of the Philippine region) and Langs. of India.

Ethnicity / Ancestry

Culture is shared learned behavior. We learn it from our parents, their parents, our houses of worship, and much of our culture – our learned behavior – comes from our ancestors. That is why ancestry and ethnicity can be so interesting and important to understand: places with concentrations of people of one or more ancestries often express those shared learned behaviors and this gives each neighborhood its own culture. Even different neighborhoods in the same city can have drastically different cultures.

In the St. Pete / Saint Peters University neighborhood in Jersey City, NJ, residents most commonly identify their ethnicity or ancestry as Asian (11.6%). There are also a number of people of Dominican ancestry (11.2%), and residents who report South American roots (7.1%), and some of the residents are also of Arab ancestry (7.0%), along with some Italian ancestry residents (5.9%), among others. In addition, 52.6% of the residents of this neighborhood were born in another country.

Getting to Work

Even if your neighborhood is walkable, you may still have to drive to your place of work. Some neighborhoods are located where many can get to work in just a few minutes, while others are located such that most residents have a long and arduous commute. The greatest number of commuters in St. Pete / Saint Peters University neighborhood spend between 45 minutes and one hour commuting one-way to work (31.8% of working residents), longer and tougher than most commutes in America.

Here most residents (33.9%) drive alone in a private automobile to get to work. In addition, quite a number also ride the bus to get to work (17.2%) and 14.9% of residents also take the train for their daily commute. In a neighborhood like this, as in most of the nation, many residents find owning a car useful for getting to work.


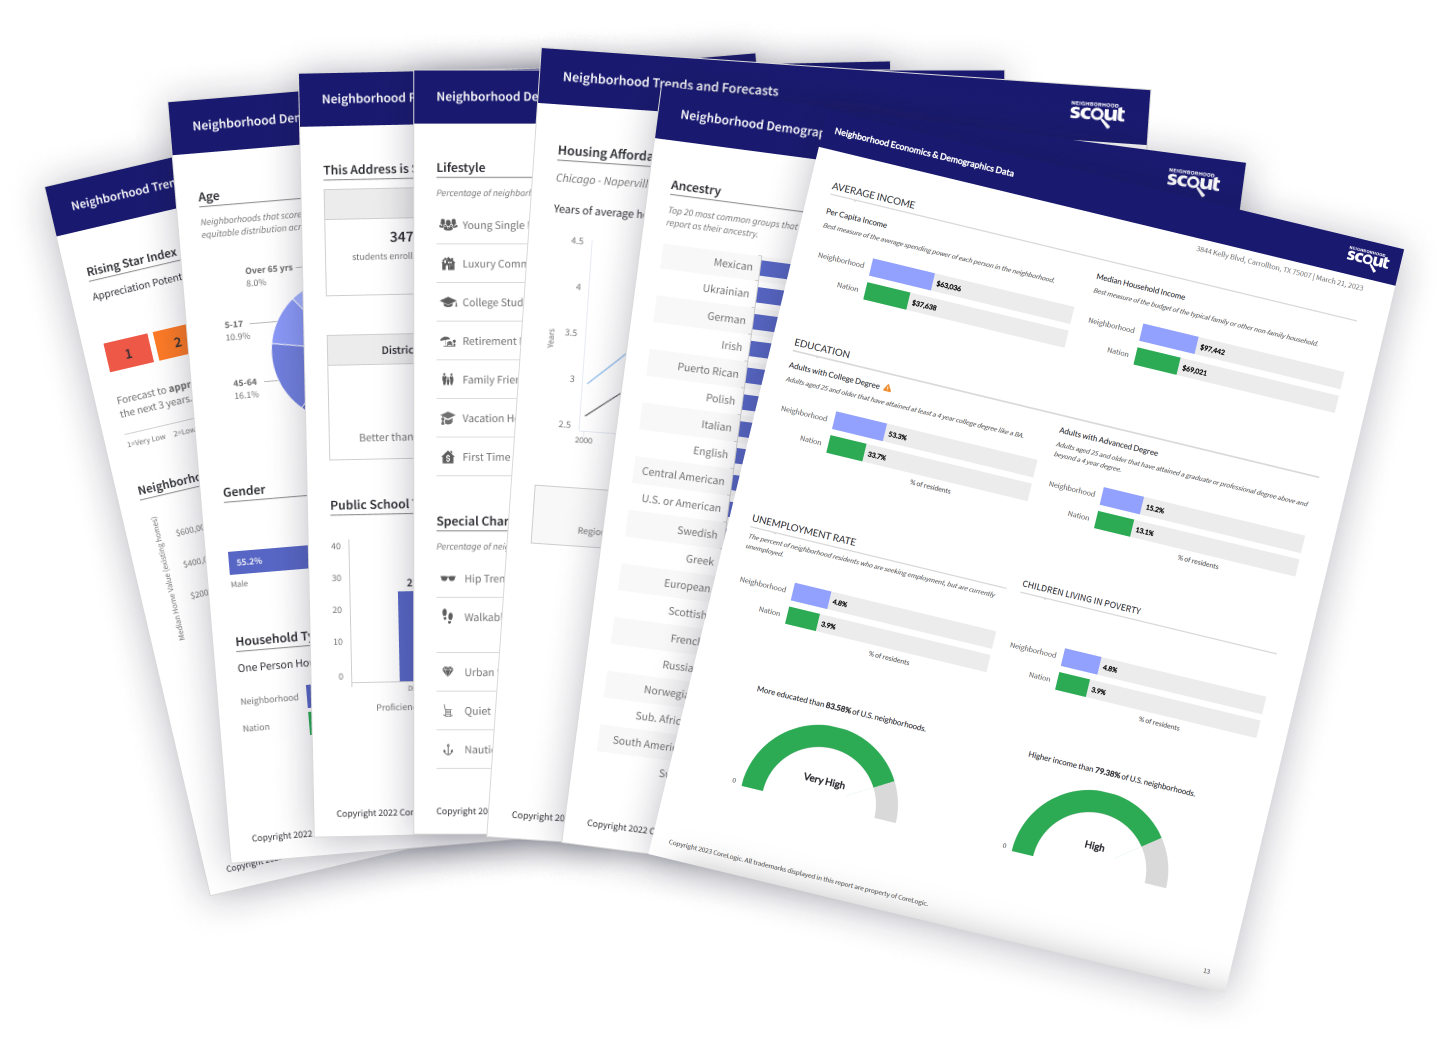
Real Estate includes:
Average Home Values
Rental Market
Housing Market Details
Neighborhood Setting
Economics & Demographics include:
Lifestyle & Special Character
Household Types
Commute To Work
Migration & Mobility
Race & Ethnic Diversity
Employment Industries & Occupations
Income & Unemployment Rate
Higher Education Attainment
Crime includes:
Neighborhood Crime Index
Crimes Per Square Mile
Property Crime Comparison
Violent Crime Comparison
Schools include:
School Ratings
Schools In District
Public School Test Scores
School District Enrollment
Educational Expenditures

comparable neighborhoods nearby